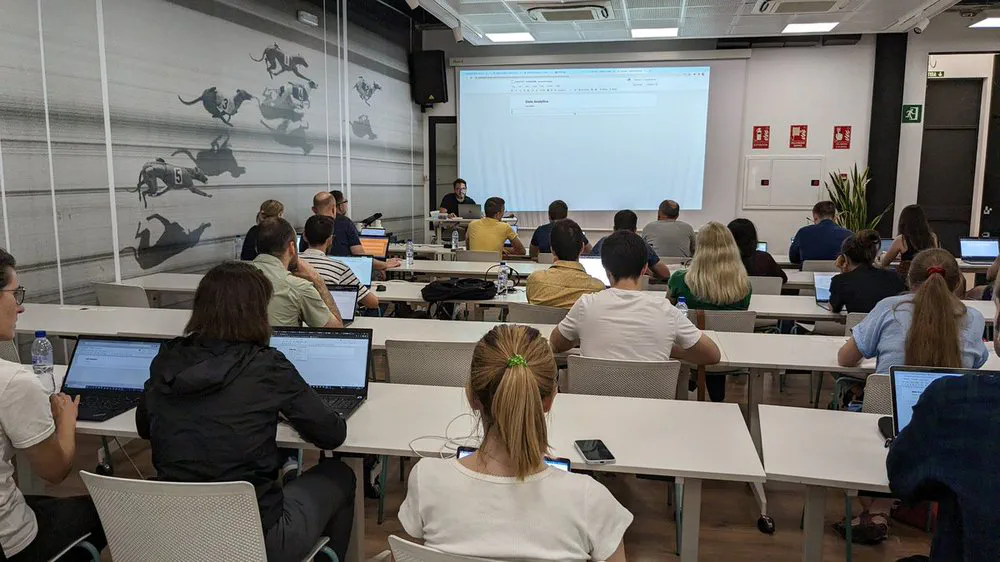
Data Analytics with Python
- Speaker
- Juan Bernardo Lince
- Event
- PyDataBCN (2023)
- Date
- Type
- Workshop
- Language
- English
- Topic
- Data Analysis
- Length
- 75 minutes
About this talk
Introduction to Data Analytics with Python and Pandas, building a parallel with Excel on how to create columns, summarize information and retrieve quick statistics. Questions, such as “how can we process data with code?” and “which issues should I be addressing with data?” will be explored, through guided examples on a dataset, to answer business inquiries.
In the second part, examples on Pandas built-in quick plots will be provided. Additionally, we will use Seaborn to create charts and other visual information that enable us to show the answers from the analysis, in a clear and objective manner.
Photos (1)